Euclid’s “First Light” engineering images show a lot of things. There are obviously some astronomical objects, but also some stranger features that are not. The reason is that these images are “raw”, they have not been digitally treated the ways as needs to be done to create science-ready images. They contain a lot of features that are properties of the detectors used, but also unwanted internal reflections of the optics, as well as cosmic rays that hit all space telescopes. Converting these images into science-ready data is the task of the Euclid Science Ground Segment, which has developed a huge and very detailed data treatment (“data reduction”) pipeline over many years.
Here we want to walk you through some of the prominent features in these first Euclid images, to explain which ones are celestial objects, and which ones have to be masked out or removed once Euclid is starting its sky surveys.
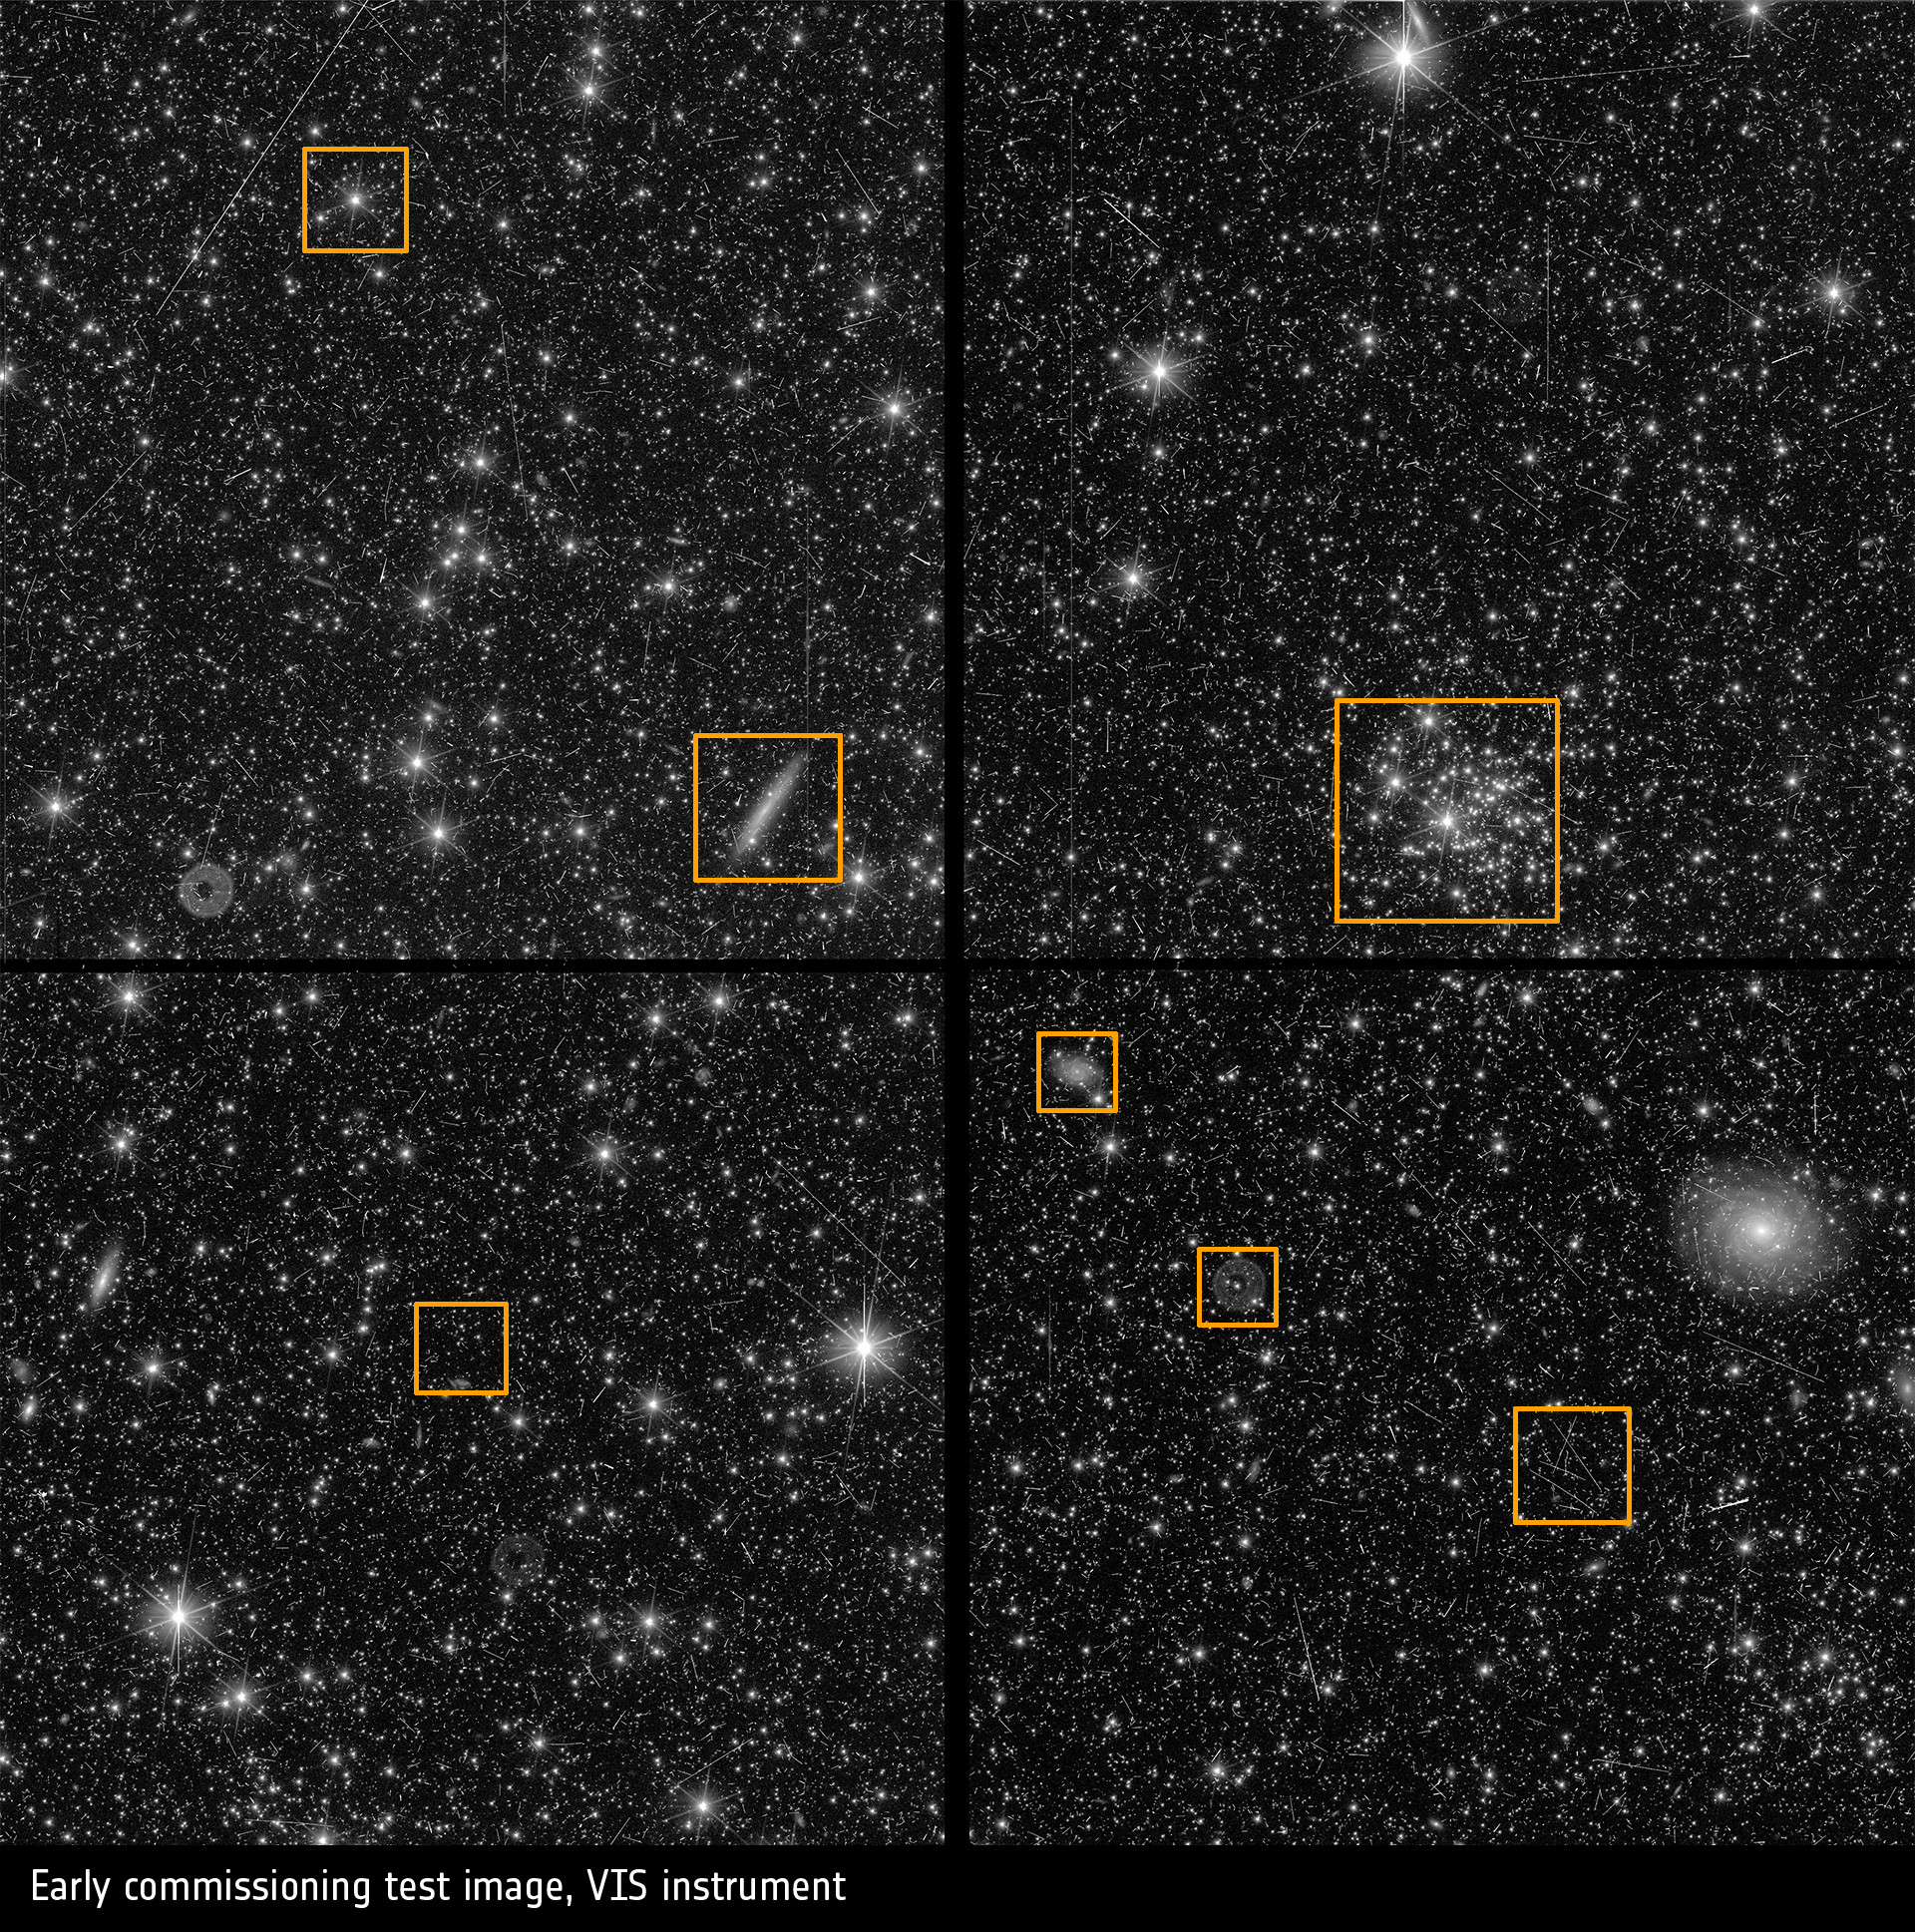
The visible imager (VIS) image
The image below is the first light image from a single detector of VIS, the visible instrument onboard Euclid. It operates in the visible wavelength range and each of VIS’ 36 detectors has about 17 million pixels.
Seven features are highlighted here, we’ll start with the actual celestial objects and then move to artefacts.
Credits: ESA/Euclid/Euclid Consortium/NASA, CC BY-SA 3.0 IGO
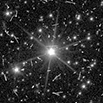
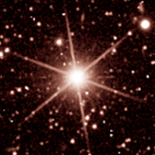
This bright object at the center of the left image is a star, also called a point source as far away, they just appear as a point. The star is actually so bright compare to the other celestial object on the picture that its central part is “saturated” seeing more light in this exposure – and correspondingly more electric charge signal – than the detector pixel can register. The prominent six “spikes” are an optical effect created for all point sources by light-paths bent by the struts that hold the secondary mirror in place. For extremely bright stars one can actually see another set of six spikes at fainter levels, created by a different effect.
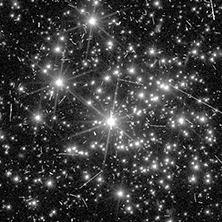
We can also see several bright stars in the top-right image surrounded by many more less luminous ones. This is a stellar cluster (actually it has a name, “NGC 2177”). All these stars composing the cluster are physically close to each other as thay have formed in one common region.

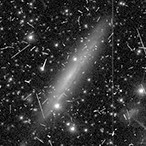
The two next images feature large galaxies. These celestial objects contain stars, dust, gas and dark matter held together by gravity. There are different types of galaxies and the ones that we see on the pictures are spiral galaxies as they show spiral arms with a diffuse light around it. The one on the left image is seen almost face-on while the one on the right is seen edge-on.

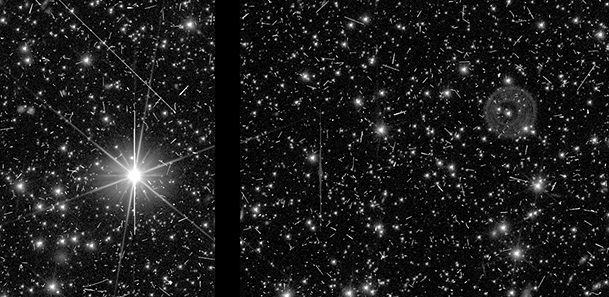
A ghost! In the image above left, also visible in the image on the right, we are not seeing a celestial object, but an artefact of the optics. An “optical ghost” is what such defocussed rings of multiply-reflected light are called. Light from a bright star gets reflected off the back side of the dichroic beam splitter of Euclid and a very small fraction gets back into VIS, but with its image smeared out, not in focus. The bright spot in the center does not belong to the ghost images, but is an unrelated celestial object or artefact.
This bright star to the left is actually the one whose light is multiply reflected to make the ghost image. You will be able to see several of these ghosts in the high-resolution image – and see their originating stars always in a similar direction and distance.

In the above-left image, these stripes are cosmic rays that hit the detector, the longer they appear the flatter the angle at which they zip across the pixels. Cosmic rays deposite part or all of their high energy by collisions with the atoms in the semiconductor material of the detectors. They knock out electrons which then add to the charge in those pixels that normal photons would create. If a cosmic ray hits perpendicular to the detector chip it might just affect one or two pixels – in any case is their signature usually much sharper and narrower than that of actual stars or galaxies.
In the above-right image, we can see a mixed bag of “background” sky. Though one (or two!) faint galaxies is present near the bottom, the rest of the visible dots is either cosmic rays or a combination of pixels with a different sensitivity than the bulk of pixels around them and some faint stars.
With the image reduction pipeline all features that appear only on one image at this position are clearly not from a star or galaxy, as they don’t move (so fast) and hence can be flagged and subsequently removed.
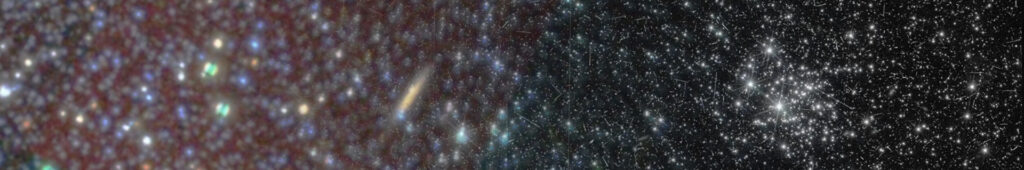
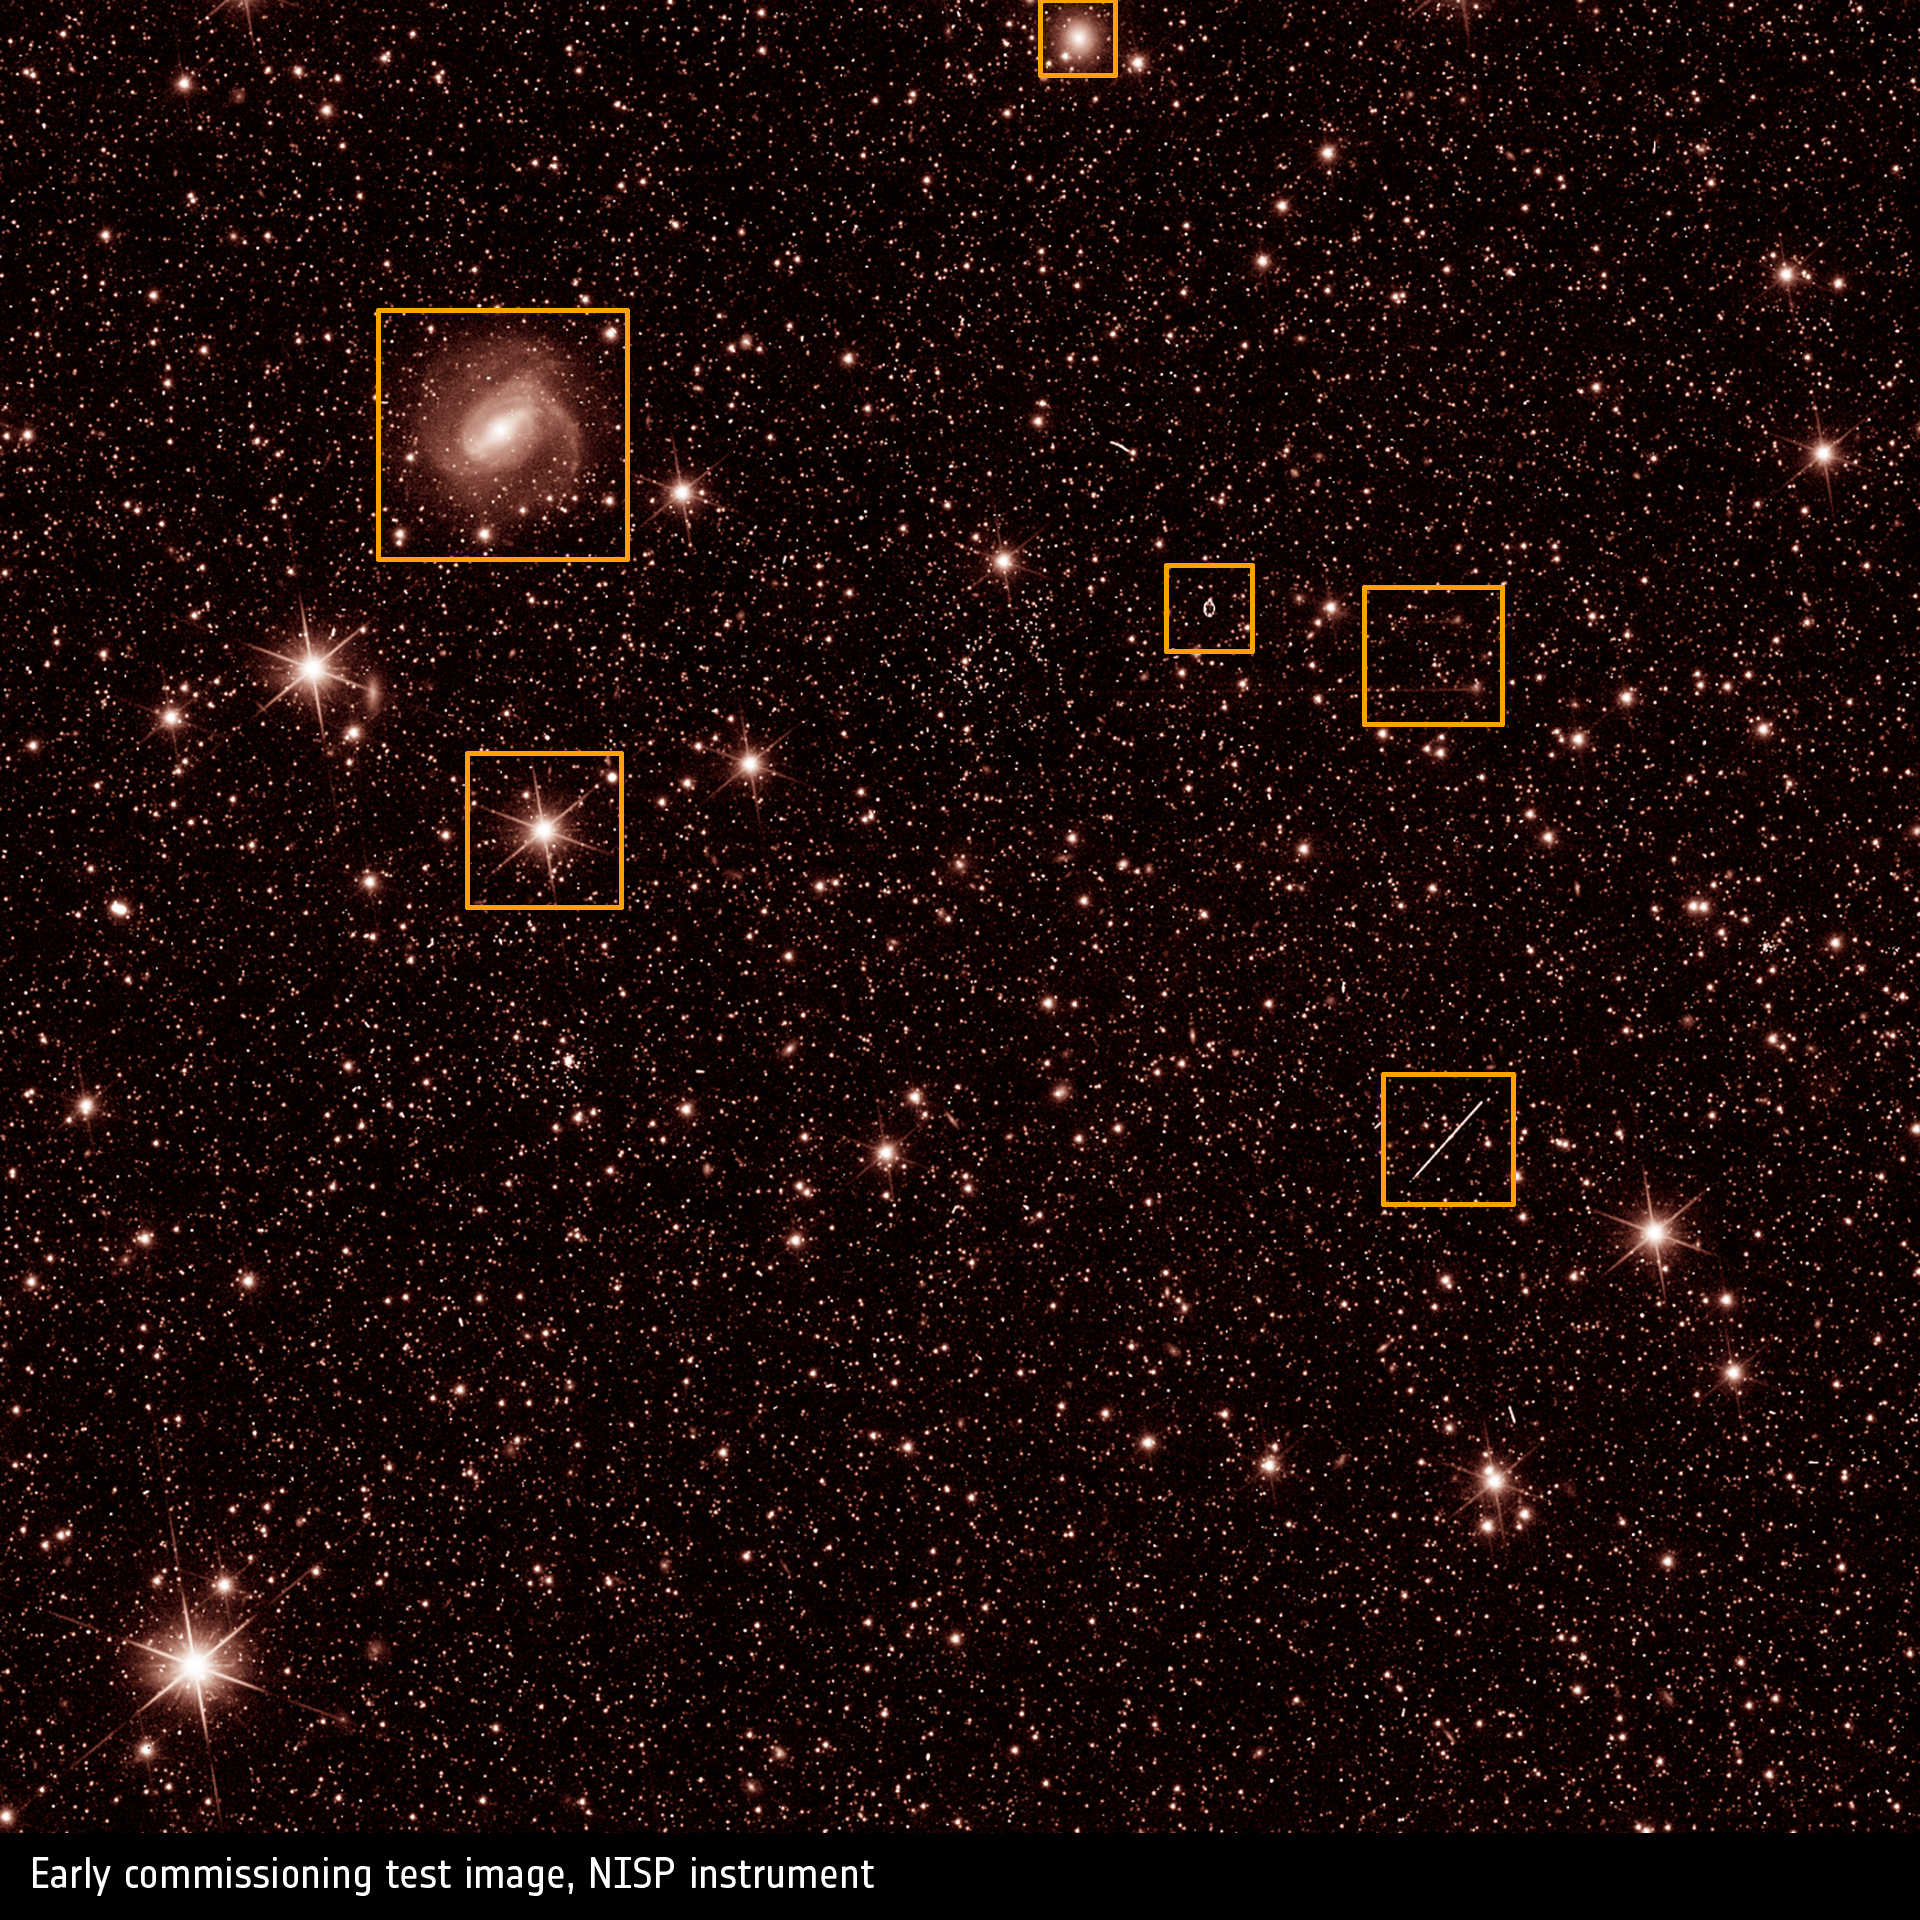
The near-infrared photometric image
Credits: ESA/Euclid/Euclid Consortium/NASA, CC BY-SA 3.0 IGO
This first light image is from the photometry mode of the near-infrared instrument onboard Euclid: NISP. It operates in the near-infrared wavelength range between ~1 and 2 micrometers. Each of NISP’s 16 detectors has about 4.2 million pixels. This cutout shows about half the area of a NISP detector, the same are on the sky (7×7 arcminutes²) as shown for VIS above.
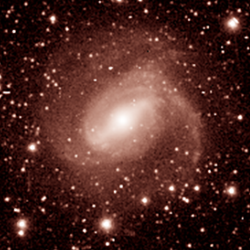

The most prominent celestial object is the spiral galaxy, seen on almost face-on on the above-left image. It comprises a nuclei denser than the other regions, some diffuse spiral arms and a bar in the middle. The image above in the middle also exhibit a galaxy, but from a different type. This is what is called an elliptical or spheroidal galaxy. Those do not have are no arms nor substantial substructure.
As for VIS, any bright point source – mostly stars – in NISP will have a visible six-spike pattern and a saturated center as seen on the above-right image.

As a difference to VIS, there will only be few long cosmic ray hits as the one shown on the above-left image. Due to a much thinner active layer in NISP detectors, the probability that a cosmic ray flies exactly in that plane are much smaller than in VIS. Most cosmic ray hits will be points, affecting only a single pixel like the bright one here below and slightly to the left of the center of the field. If you look around you will find a few extended cosmic ray streaks, but not that many.
The strange feature in the center of the above-center image is an artefact coming from a region of the NISP detector chip that has either a different sensitivity or has a higher so-called “dark current” – a charge signal that builds up even in the absence of photons hitting a pixel. Effects like this can be calibrated out or, if too severe, are masked out so that areas like this might not be used to contribute information to the final image.
The two streaks in the above-right picture are due to the so-called “persistence charge” effect that comes from a property of near-infrared detectors. Some electrons created in previous exposures can be “trapped” inside the pixel substrate and only be released over some time. If the previous illumination of a pixel was very high, e.g. due to a very bright star, this can leave a detectable phantom signal at those pixels in subsequent exposures. Here we have the case of two positions of stars that their light fall onto the NISP detector. In addition – since these are engineering observations – the telescope was before also moved, creating these streaks to the left. These stars were so bright, that even these streaks now created a persistence signal that we can see.
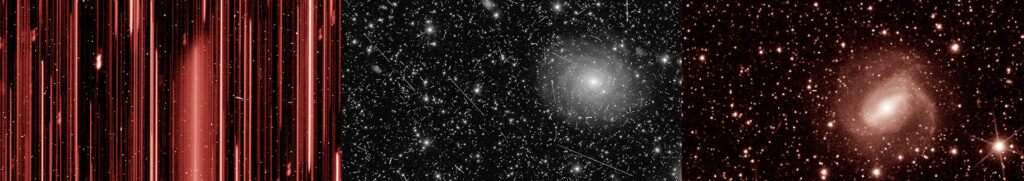
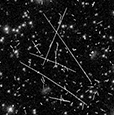
The near-infrared spectroscopic image
NISP can operates through a photometric mode (as seen above) which is produced by imaging through one the filters, or a spectroscopic one, which is obtained by taking an image through one of the grisms. The spectroscopic mode of the NISP also operates in the near-infrared wavelength range between ~1 and 2 micrometers. This cutout as before shows about half the area of a NISP detector (7×7 arcminutes²).
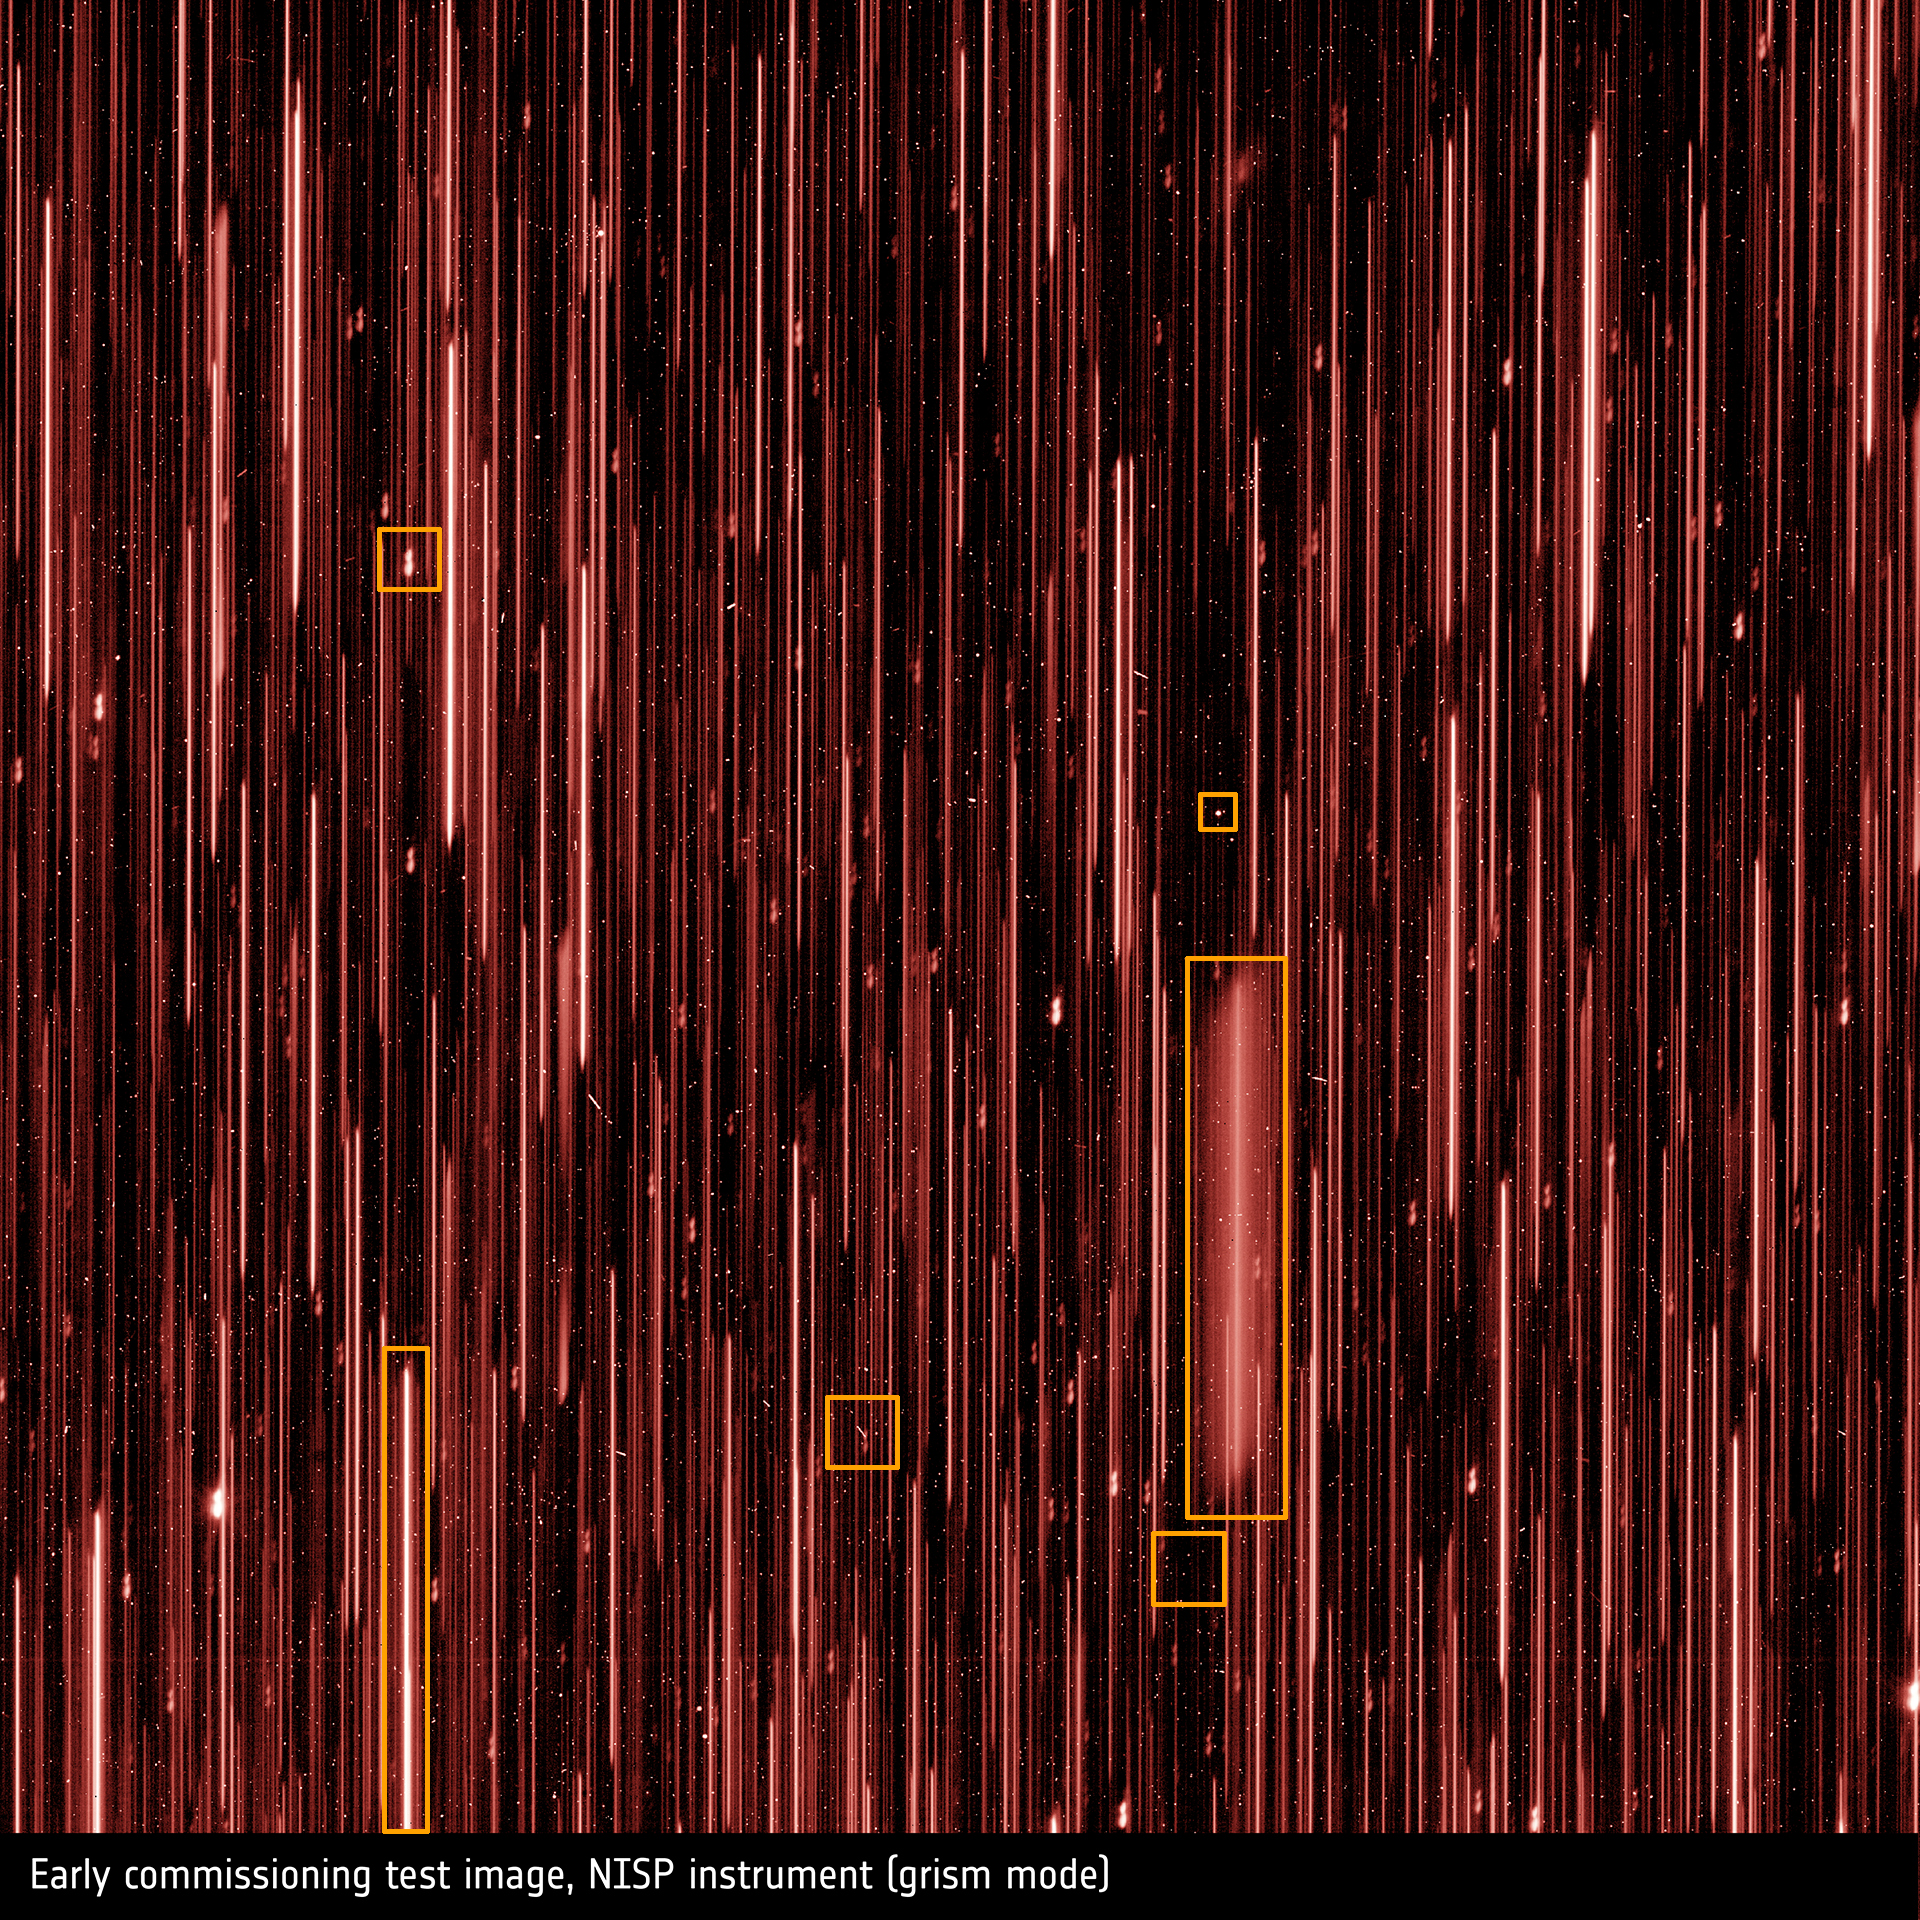
Credits: ESA/Euclid/Euclid Consortium/NASA, CC BY-SA 3.0 IGO
The first thing that catches the eye is that is looks completely different: vertical streaks instead of points. This is because grisms disperse the light of all objects into different wavelengths. Therefore, each streak belongs to one object and the detected wavelength runs from shorter to longer wavelengths from top to bottom on the image above. If an objects emits more light at shorter than longer wavelengths, then the spectrum streak would show more light in one part than the other. Since the objects are distributed over the sky, the starting point and wavelength scale is different for each object.


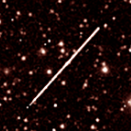
The image on the top-left above is a spectrum (flipped sideways from the full image) of a compact object, likely a bright star. There are also a few other fainter streaks next to it, these are spectra from other objects.
The streak that has the widest spread wavelengths is what scientists call the “first order” of the spectrum. This is the one that will be scientifically used to determine the spectral energy distribution and distance of galaxies.
The bright feature in the above-right image is also the spectrum of that same star. This is not however the first order of the spectrum, but the so-called “zeroth order”. For some spectrographs this is simply a point – which would simply be an image as in photometry, only fainter – but for the optics of NISP even the zeroth order is slightly dispersed in wavelength and gets this characteristic peanut shape. This will not be used for science exploitation, but they anchor the position of the object in the field, and therefore define the wavelength scale one has to apply.
If you look closely you’ll find a zeroth order for every first-order streak. Unless they are beyond the edge of the frame.
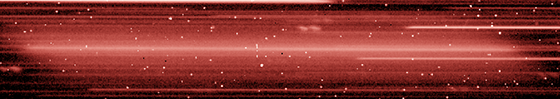
In the above bottom-left image, you can see a first order spectrum (rotated as well for presentation purposes) – but now of an extended source, not a star: this is the slitless grism spectrum of a galaxy. These first order spectra are as wide as the objects would appear in a direct image. A star, being a point source, will appear only ~2-3 pixels wide, as in the NISP photometry images above. This galaxy spectrum is as wide as the galaxy would be, and also can contain substructure if e.g. coming from a spiral galaxy with substructure. In the dispersion direction – along the streak – the spatial information is smeared out.
If you look carefully you will also find a fuzzy zeroth order image of this galaxy further towards the top of the high-resolution image.


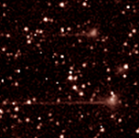
These three images show some artefacts that can be found on NISP spectroscopic images. Cosmic rays can also be seen in a spectroscopic image as shown in the image on the left. It doesn’t matter how light is projected onto the detectors, the cosmic rays are independent of that and come from all unshielded directions. So here’s a cosmic ray hit at the angle where it originated from in space.
Since the light of all objects is dispersed, the image above in the middle allows nicely to highlight other artefacts – which are sometimes difficult to distinguish from faint stars on single images like this. But everything that is point like, as we see here, has to be a detector effect and is not an actual object in the sky.
In the second image we see a few cosmic ray hits, mostly perpendicular to the detector, so not making a streak. But also showing some “hot pixels”. Those are pixels in the detector that permanently show a very high signal or that have a very high photon-to-signal conversion rate. If this is a mild effect then this can be calibrated out, if it’s severe then these pixels are permantly masked out and not used for science. As one can see, the fraction is not very high, of the order of less than 0.1%. So the loss of data is limited.
And finally, this looks like a star, because it’s much larger than a cosmic ray hit or single hot pixel. But since this is a dispersed grism image, it can’t be. It is what is called a “snowball”. The origin is charge that gets injected from inside the detector. Currently the favourited explanation is that this charge originates from radioactive decay of atoms inside the detector structure, another one are cosmic ray muons.
And there we are. Now you can hopefully understand all common features and structures in these first light images and get an idea of the massive work the science ground segment teams will need to do to produce science-ready images.